(For the Korean version, click here)
As an engineer, you will eventually face critical moments when a service suddenly slows down or becomes unresponsive. While Parts 9 and 10 focused on tracing the past through logs, today we focus on the present: “Who is eating up my server’s resources right now?”
In this post, we will dissect the top command—the essential tool for diagnosing server health—along with its visual alternative htop, and the techniques for identifying and terminating problematic processes using ps and kill.
1. The Real-time Diagnosis Chart: Understanding top
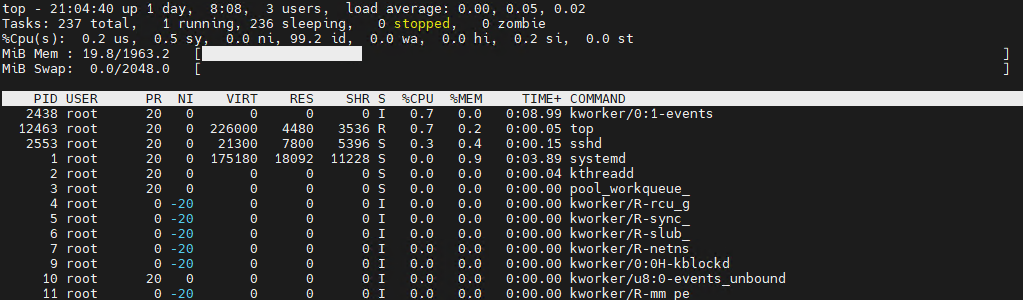
Running top provides a flood of information. Here is how to decode the most critical metrics used in professional troubleshooting.
① The Summary Area (System Overview)
- Load Average: The average number of processes waiting for CPU time (over 1, 5, and 15-minute intervals).
- Tip: If these numbers are higher than your total CPU core count, your server is officially overloaded.
- %Cpu(s): Where is the CPU spending its time?
us(user): Time spent running user applications (Nginx, Database, etc.).sy(system): Time spent on kernel and system-level tasks.id(idle): The percentage of time the CPU is doing nothing. (Lower values mean a busier server.)wa(iowait): Disk I/O waiting. If this is high, the bottleneck isn’t the CPU itself—it’s likely your slow disk storage.
② The Process List
- RES (Resident Size): The actual physical memory (RAM) a process is using. This is a much more accurate metric than VIRT (Virtual Memory) when checking for memory leaks.
- S (Status):
R(Running),S(Sleeping),Z(Zombie – terminated but still holding resources).
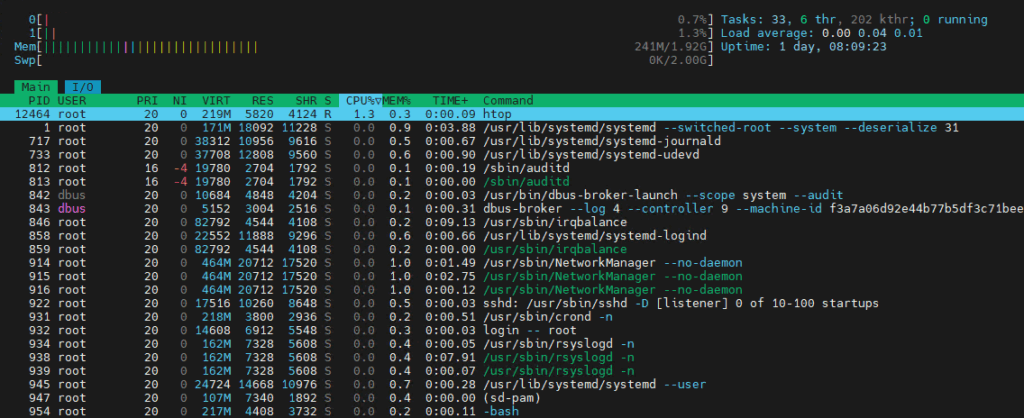
2. A Visual Alternative: htop
If the standard top interface feels too archaic, htop is an excellent alternative. While it requires a separate installation (yum install htop), it provides a much more intuitive experience with color-coded bar graphs for CPU cores and the ability to scroll and select processes with your mouse or arrow keys. I recommend switching to htop once you are comfortable with the core metrics found in top.
3. The Standard for Investigation: ps (Process Status)
While top is live, ps provides a snapshot of the process state at a specific moment. There are two primary “schools” of options you should know:
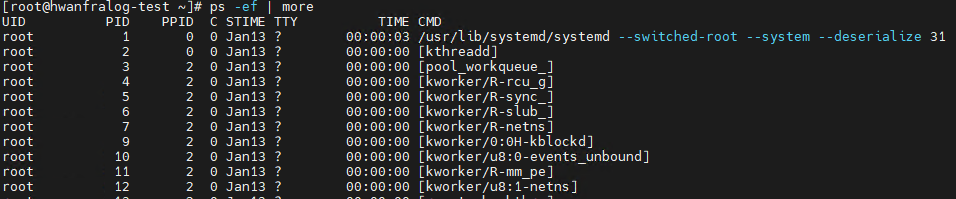
ps -ef(System V style): Displays all processes in a hierarchical structure. It shows the Parent Process ID (PPID), which is vital for tracing which service spawned a specific process.
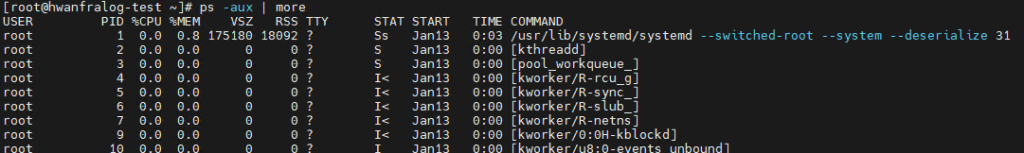
ps aux(BSD style): Includes CPU and memory usage percentages. This is the go-to command for instantly identifying resource hogs without entering an interactive mode.
Advanced ps Tips for Pros:
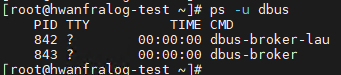
- Filter by user:
ps -u [username](e.g.,ps -u nginx)
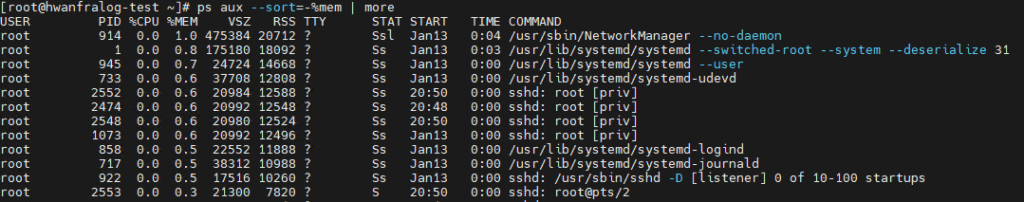
- Sort by memory usage:
ps aux --sort=-%mem
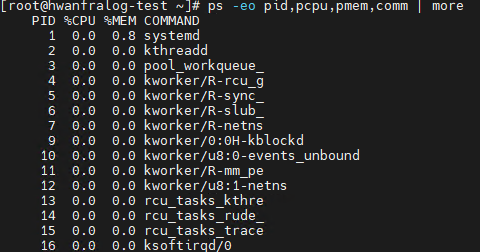
- Custom output columns:
ps -eo pid,pcpu,pmem,comm(Display only PID, CPU%, MEM%, and Command)
4. The Art of Termination: kill & Signals
The kill command isn’t just for “killing” a process; it is a tool for sending ‘Signals’ to a process.
| Signal No. | Name | Meaning & Practical Use |
| 1 | SIGHUP | Reload. Tells a service to reload its configuration files without shutting down. |
| 15 | SIGTERM | Graceful Shutdown. Asks the process to clean up and close safely. (Default) |
| 9 | SIGKILL | Forced Kill. Terminates the process immediately without cleanup. Risk of data loss. |
- Batch Termination by Name:
pkill -f [pattern]: Terminates all processes whose command line matches the pattern.killall [process_name]: Terminates all processes that exactly match the name.
5. [Practice] Identifying and Terminating a Resource Hog
Let’s create a dummy process that stresses the CPU, identify it, and terminate it.
Bash
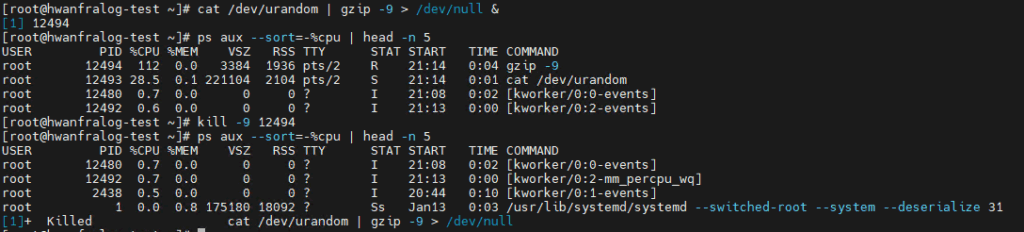
# 1. Run a CPU-intensive command in the background
cat /dev/urandom | gzip -9 > /dev/null &

# 2. Find the top 5 CPU consumers using ps aux
ps aux --sort=-%cpu | head -n 5

# 3. Identify the PID and try a 'Graceful' shutdown first
kill -15 [PID]

# 4. If it's still running after 5 seconds, use the 'Forced' kill
kill -9 [PID]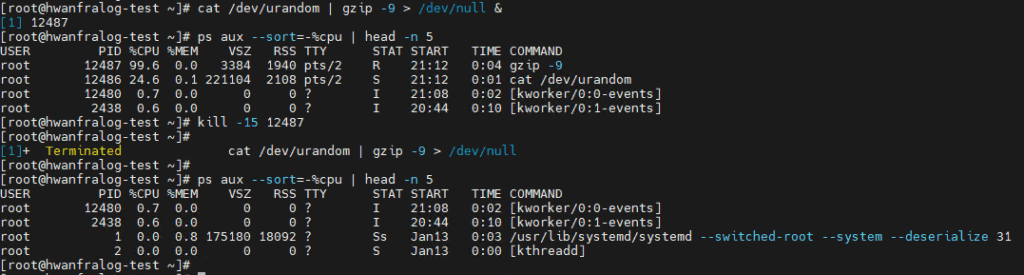
💡 Engineer’s Insights
“In a crisis, it’s tempting to fire off a
kill -9immediately out of frustration. But think of it like tackling an employee who’s trying to leave the office and knocking them unconscious.Processes need ‘cleanup time’ to close open files and save data.
kill -9skips this, which can lead to corrupted data or broken database indexes. Always trykill -15first and give it 5 seconds. That 5-second wait might just save your data.”
🚀 Coming Up Next
Now that you’ve mastered process management, it’s time to inspect how the server communicates with the outside world. In [Linux Practical Basics #12], we will cover Checking Network Ports and Setting Static IPs (nmcli/nmconnection)!