(For the Korean version, click here)
For an engineer, logs are like “SOS signals sent by the server.” If we learned how to find the right files in Part 9, it is now time to read and interpret the messages pouring out of them in real-time.
Today, we will cover real-time log monitoring techniques—how to pinpoint specific errors as they happen without getting overwhelmed by massive log files that can reach hundreds of megabytes or even gigabytes.
1. The Standard for Real-time Monitoring: tail -f
The tail command is originally designed to show only the last part of a file. However, by adding the -f (follow) option, it transforms into a powerful live-streaming tool for your server’s current status.
- Options I Frequently Use in the Field:
tail -f access.log: Continuously outputs new lines to the screen as they are added to the file.tail -100f access.log: Shows the last 100 lines first, then starts live tracking. (Great for connecting past context with current events.)tail -f access.log | grep --line-buffered "ERROR": Filters the live stream to show only lines containing “ERROR.”
2. A Safe Harbor for Massive Logs: less
Have you ever experienced a server freeze after opening a multi-gigabyte log file with vi? Professional engineers never use vi or cat for massive log files. The correct answer is less.
- Why
less?- It doesn’t load the entire file into memory. It only reads enough to fill your screen, so even gigabyte-sized files open instantly without stressing the system.
- Cheat Sheet for Shortcuts inside
less:Shift + G: Move to the very end of the file (most recent logs).g: Move to the very beginning of the file./keyword: Search forward (pressnfor the next result).F: Enter “Follow” mode, similar totail -f(pressCtrl + Cto exit back to normal mode).
3. Digging into Compressed Past Logs: zgrep
To manage storage, Linux servers often compress old logs into .gz files. Unzipping them just to check the contents is highly inefficient. This is where zgrep comes in—it allows you to search inside compressed files without extracting them.
- Practical Example
# Search for a specific IP address (e.g., 192.168.0.1) in compressed logs from a few days agozgrep "192.168.0.1" access.log.2024-01-10.gz4. [Practice] Creating and Tracking a Fake Log Stream
For this exercise, let’s create a dummy log file that records the current time every second and track it.
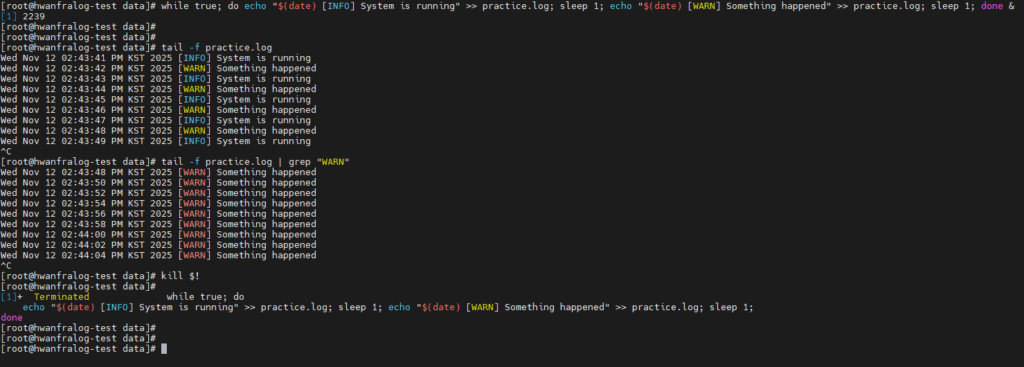
# 1. Run an infinite loop that logs messages every second (Background process)
while true; do echo "$(date) [INFO] System is running" >> practice.log; sleep 1; echo "$(date) [WARN] Something happened" >> practice.log; sleep 1; done &

# 2. Start real-time monitoring
tail -f practice.log

# 3. Filter and view only 'WARN' messages
tail -f practice.log | grep "WARN"

# 4. End the practice (Kill the background process)
kill $!
5. The Professional Suite: “Log Analysis is a Race Against Time”
In a real troubleshooting scenario, the workflow usually looks like this:
- Use
findto locate the log files for the specific timeframe. - Use a combination of
tail -fandgrepto identify incoming error patterns in real-time. - Once the situation is stabilized, use
lessto review the entire sequence of events for a post-mortem.
💡 Engineer’s Insights
“In my early days, my first instinct was always to open logs with
vi. But after seeing a server gasp for air in front of a multi-gigabyte log file,lessandtailbecame my first line of defense.If
xargsfrom Part 9 was the delivery driver connecting commands, the combination oftail -fandgrepis like a high-powered CCTV camera for catching ‘bugs’ in the act. The real skill isn’t just watching the text scroll by; it’s about filtering out the noise to see the core issue. That is the hallmark of a true professional.”